
Operations Dashboard Applications
Monitor and evaluate your Business’s Daily Activity
Operations Dashboard is a “dashboard” (think an airplane or your car’s dashboard) where all data and information (important factors, numbers and parameters all put together) of your business are presented in the simplest possible way to facilitate the overall operation of the business. The Dashboard is intended to help top Management to create, implement and achieve the strategic business plan (Strategic Dashboard) facilitating the decision-making process, to monitor the performance of business operations (Tactical Dashboard) in relation to the objectives of the strategic plan and to provide the business executives (Operational Dashboard) the understanding of their department’s contribution towards business objective.
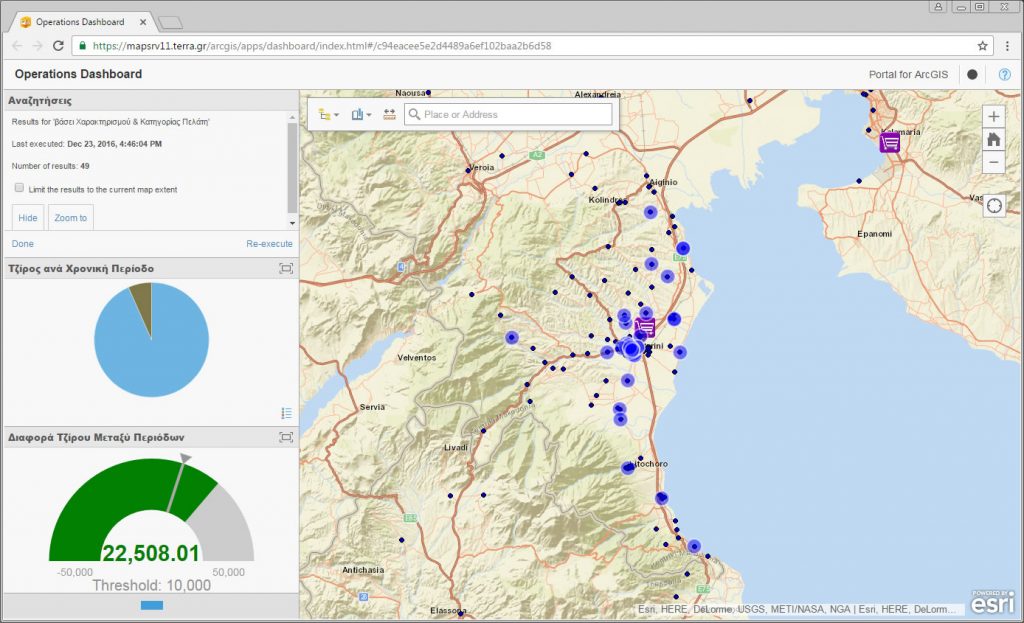
Terra’s GIS Operations Dashboard introduces metrics and key performance indicators (KPIs) of your business in the form of diagrams (bar graphs, pie charts, line charts, bubble charts), descriptive excel like tables and gauges, and combines them with spatial information (maps). For the first time, interact among charts, gauges, descriptive tables and maps by selecting one of them and view the result (the response) in another. For example, choose the 5 minute service area from your store and see your sales by type or time period for this time zone on a chart or a gauge showing the goal marker (threshold) and in a comparison table with exporting capability to an excel type format.